|
Thirst and water
ENDA Tiers Monde (Environment Development in the Third World)
It is undeniable that
poverty is on the increase in Senegal. Taking a 15 year
period (1980-1994), the per capita growth index gives a
negative result. The fact that in the last two years
growth has been positive does not in any way reverse this
tendency.
The adjustment
programmes initiated in the early eighties were based on
the reduction of internal demand, opening up the economy
to the foreign sector and balancing accounts, putting
these as conditions necessary for the recovery of growth
and to progressively eradicate poverty. More than fifteen
years later, although the accounts have improved, foreign
and domestic trade have been liberalised and the
privatisations have been brought about, these measures
have not consolidated a growth dynamic, nor is poverty is
on the way to being eradicated.
A look at the
representative social data show, on the contrary, that
the advances seen throughout the seventies have slowed
due to the austere budgeting and the reduction of the
State commitment. First of all there is a worrying
situation in terms of access to basic services (health,
education, drinking water, sanitation) and employment,
particularly amongst young people and women. Poverty
shows itself in the indigence of families and of their
children, and also, in a more general way, in the
increased vulnerability and fragility of the social
fabric.
The last containing
element, the fixed parity between the CFA and the French
frank, which was considered an obstacle to the adjustment
of West African economies, gave way in 1994 under
pressure from the World Bank and the International
Monetary Fund (IMF). The near 100% devaluation of the
currency produced official inflation of around 40% in
1994-1995 and as a consequence, a drastic reduction of
real income for both waged and rural workers. Nothing we
have seen allows us to say these sacrifices have helped
improve the situations of those who suffered.
The vital issue is to
know if economic growth in the context of economic
liberalisation is compatible with the aim of reducing
poverty. Or, as occurs in so many countries (the United
States, Britain), we have to settle for a situation of
economic growth accompanied by an increase in poverty.
It is worth considering
the differences in attitude when we are dealing with
measuring the consequences of the macroeconomic policies
in terms of poverty and the worsening of living
conditions. Consequently, despite certain arguments and
some action limited in time, there is a real deficit of
relevant data on the development of the living
conditions. On another front, the facts appear to
indicate the problem of poverty is a taboo issue. As
though at all times the poor, by their mere existence,
were flaunting the failures of one and all and open even
the most seductive models up to judgement.
Discussing the issue of
poverty, its causes and manifestations, would go against
the predominant rhetoric of liberalisation, which has
been leading the field for several years. Such a
controversy would force us to interrogate ourselves about
the real impact of the said policies on growth and the
effects of these on poverty. It would propose the
political dilemma of knowing who really benefits, both at
home and abroad, from the structural adjustment
programmes, the privatisations, the liberalisation of
foreign trade and the budget redistribution.
There is little
continuous information on poverty in Senegal. The
existing data come from one-off studies which do not
allow for trustworthy comparisons to be made over time,
nor between socio-economic groups. It is possible,
however, to read the situation through different partial
sources of information from different sectors or on
macro-economic issues.
The most recent
available studies, along with the sectoral data, show a
worrying social situation, in relation to comparable
countries: a very low level of schooling, a high
percentage of illiteracy, poor access to drinking water
in the urban and rural media, a mediocre life expectancy,
a high incidence of hygiene and water related diseases,
incipient urban sanitation, and bad access to the health
services.
They all agree that
poverty has not stopped increasing in Senegal over recent
years: according to the World Bank, the growth in GDP
went from 3.2% on average during the eighties to 0% in
1990-1994.2 These indices show that in the whole of the
period, per capita income fell-for population growth
stands at around 3%. According to another study by the
same institution, if these tendencies are maintained,
there is a risk that poverty will affect 60% of the
population by 2015.
Already 30% of homes
live under the shadow of poverty. Some 75% live in the
rural areas where more than one in every two homes is
poor.3
The relation between
the 20% of richest to the 20% of poorest homes is more
than 16.7% for the 1981-93 period.4 The top 40% of the
population takes three quarters of monetary income of the
country. And 71% of this income is earned in the urban
environment compared with 29% in the rural zones.5
There is no precise
information on the number of women living in poverty. But
we can however, state that the number of households
headed by women is relatively high (16%), without this
situation having specific measures to deal with it.6 A
large proportion of these homes live in conditions of
indigence.
Also in the mid and
high Senegal river valley (in the north of the country),
a zone with high immigration levels of male workers,
there is a clear feminisation of the rural population and
increasing poverty, whereby these women do not benefit
from the production factors to the same extent as the
men.
Child labour is a
traditional phenomenon in rural areas and common in urban
zones, and according to the International Labour
Organisation, 10% of the whole child population is
carrying out some paid task. A survey by the Office of
Forecasts and Statistics on child labour showed 82% of
girl children work in agriculture or domestic tasks.
Three quarters of all working children are employed in
agriculture while 13% work in urban tasks.7
However, child labour
cannot only be interpreted only as a factor of poverty
nor as a manifestation of this. Child labour is for the
most part an educational factor which occurs mainly in
the rural environment, for the child's future insertion
into working life. In the urban medium, in the context of
absolute poverty, where there is a lack of schooling
perspectives and employment opportunities for the
parents, child labour, in particular amongst the working
class urban economy, appears to be the only way of
offering the children an apprenticeship for life,
providing a supplementary income for a large part of the
population.
The percentage of
unemployment, if this can be considered a valid
indicator, appeared quite low in 1995. The index went
from 4.9 % of women in 1988 to 8.9% in 1988 and 10.3% in
1995.8 In the urban areas it is 24.5% for men and 21.6%
for women.9 Still within the urban area, 40% of people in
the 20 to 34 age group are unemployed.
However, the form in
which the percentage of unemployment is calculated only
works as a partial indicator as it does not take into
account the underemployed, in particular in the working
urban economy (informal sector) and in the rural zones,
nor the women at home counted as passive population, nor
those who have given up looking for a job. The fact that
these cases are not considered, along with the extreme
youth of the population, explains the 58% registered in
the inactivity index.10
Between 1975 and 1980,
36% of the Senegalese population had access to clean
drinking water. Between 1990 and 1995, this index rose to
52%, 28% in the rural zones and 85% in the urban areas.11
But while the
availability of water has increased, the daily
consumption of water per person has fallen markedly over
the last 15 years, with an even more noted drop after
adjustment. From 63 litres per person per day in 1980 in
the urban areas, it fell to 54 litres in 1994. This fall
was even more accentuated in the city of Dakar, where it
fell from 88 to 69 litres per person per day.
However, in the same
period, the SONEES index of connection to the drinking
water network continued to grow, going from 25% of homes
in 1980 to 63% in 1994.12
These apparently
contradictory developments in fact reflect great
inequality in the availability of drinking water:
inequalities between those who can have individual
connections and those who cannot, inequalities between
the rural and urban areas, inequalities within the
cities, between the underprivileged and comfortable
neighbourhoods.
As for sanitation, 58%
of the Senegalese population has this, 40% of the rural
population and 83% of the urban, from 1990 to 95.13 The
survey on the evaluation of Intermediate Objectives
estimated access to a waste-water drainage systems at 10%
in all Senegal, which is split between 23% of the rural
area and 0% of the rural zones. The availability of
adequate latrines, according to the survey, was 38% of
the total (71% in the urban area, and 13% rural).
Only 11% of the
potential housing in the country as a whole are actually
met: for the 30,000 new households formed each year in
Senegal, the public and private promoters together only
provide 2,000 homes.
This in a country with
an estimated 8,500,000 people in 1995.14 Some 48.2% of
this population is made up of men and 51.8% women.15 58%
of the Senegalese are less than 20 years old and 3.5% are
over 65, which defines a very young population. Some 60%
of the population live in the rural zones. Women make up
75% of the rural population.16
Although the average
density is still low (37 inhabitants per sq. km), the
population is growing rapidly, doubling every 25 years,17
mainly in the urban areas.
The percentage of
public investments dedicated to water and public hygiene
was 14% in 1995, showing a clear increase on figures for
1994, a year when this was barely 9%. This tendency to
rise has continued as the forecasts for 1997 indicate the
percentage of public investment destined to urban and
rural water schemes and sanitation will be around 22%.18
The adjustment policies
had clear repercussions on education, as the desire to
rationalise and reduce the unit costs of the educational
system was reflected in a restructuring of the learning
subsidiaries and professional training since a few years
ago. The average number of pupils per class went from 55
in 1985 to 62 in 1993.
The quality of
education, as is indicated by the unions, has fallen
despite the cost per pupil being reduced. There are
always serious shortfalls in school equipment, tables,
chairs, teaching materials, a lack of buildings and a
shortage of teachers. This situation is not only
explained by the large increase in size of the school
population (4% per year), but is also a result of the
structural adjustment programmes which assign other
priorities to the State budget to the detriment of the
social sectors. These results do not coincide with the
strategies established from 1981 onwards, in the General
Statutes of Education and Training, ratified in the VIII
Plan of Economic and Social Guidelines, which prioritised
primary education and the reduction of illiteracy.
The Human Resources
Development Programme for the 1994-1999 period has been
implemented with the support of investors in order to
turn back the tendencies of the past, increasing access
to primary, middle and secondary education, and improve
the efficiency of the education system and its management
and planning ability, while promoting schooling for
girls.
There is an action plan
for the year 2005 which aims to reduce illiteracy to 30%,
lessen the differences between women and men, and
diminish inequalities between the various regions and age
groups.
There are also many
initiatives from the civil society, which have been
developed during the eighties and nineties to relieve the
State shortfalls: the construction of classrooms by local
people, the participation of immigrant Senegalese and
also initiatives taken by may associations and NGOs in
the fight against illiteracy, the revaluation of national
languages...and also in the area of technical training.
Illiteracy reached 67%
amongst adults in 1995, one of the highest in the world,
distributed in the following manner: 77% women and 57%
men.19 The Planning Ministry established an even higher
figure: 82% of women aged over 15 years-old and 62.6% of
men.20
For the whole of the
Senegalese population, the index of primary school
enrolment is 26.2% amongst men and 19.2% amongst women.21
Similarly the 1996
World Development Report presented the percentages of
primary school enrolment at 50% for girls and 67% for
boys in 1993 (compared with 37 and 56% respectively in
1980).22 Despite the variations from one source of
information to another, it would seem the percentage of
school attendance is on the increase.
From 1988 to 1994, the
overall gross rate of secondary schooling went from 20.9%
to 21%.23 The index of secondary education enrolment
reached 19.7% in the urban areas an 3.1% in rural zones.
It is distributed between 9.8% of men and 5.1% of
women.24
In 1993, only 52% of
Senegalese children reached the fifth year of primary
school.25 Most children abandon school at the age of 12,
which is the last year of primary education. Girls tend
to leave earlier (at the age of 10). Only 17.5% of
pre-school and primary school children have real chances
of staying in education to secondary level.26
Education spending
corresponded to 4.4% of the GDP in 1960 and 4.2% in 1992.
Health
Health coverage has
worsened during the last decade. The number of
inhabitants per hospital went from 404,818 in 1988 to
465,510 in 1993,27 and to approximately 494,000
inhabitants per hospital in 1995,28 that is, more than
three times the WHO norm. In 1995, there were also
161,000 people per health centre (the WHO norm is 50,000)
and 11,000 people per health post (a figure closer to the
WHO recommendation of 10,000).29
A Declaration of Policy
and Health was adopted in 1989 in order to improve health
coverage, mainly in the rural and semi-urban areas, to
improve mother and baby health, develop prevention
programmes and health education, rationalise treatment
and monitor the demographic variable. This declaration
was followed by the Health District Development Plans and
the Regional Health Development Plans.
Life expectancy at the
time of birth for the whole population went from 37.3
years in 1960 to 49.5 in 1993, with 50.5 years for women
and 48.5 for men. At present the Ministry of Economy and
Finance estimates this at 54 years.
Some 40% of the
population had access to the health services in the
1985-95 period,30 (which left around 4.7 million people
without access). Most people travel on foot or donkey to
their nearest health centre.
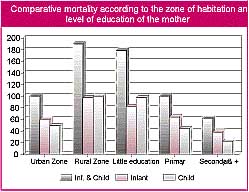
The infant mortality
index (for children under a year old) went from 120 per
1,000 live births in 1974-75 to 68 per 1,000 in the 92-93
period. This stood at 115 per 1,000 for children under
five years-old in 1994.31
The place of residence
is an important discrimination factor in relation to the
probability of infant death before reaching a year old.
Infant mortality is 55 per 1,000 in the urban areas
compared with 87 per 1,000 in the rural zones.32 (See
Graphic 1)
The index of maternal
mortality is very high as it affected 510 of every
100,000 live births in the 1979-92 period.33 The UNDP
established this was 600 per 100,000 live births from
1980 to 92.
The percentage of women
who received no prenatal care reached 4.5% in urban areas
and 52.2% in rural zones in 1988.34
Only 46% of births were
attended by health personnel between 1983 and 1994.35
Graphic 1.
The synthesised
fertility index for the whole country in 1992-93 was 6.1
children per woman.36 This has changed very little rising
to 6.8 children per woman since 1986.37 The rate is 6.8
in areas of high illiteracy and 4.6 in more literate
areas.38
The synthesised
fertility index seen in the rural zones is far higher
than that of urban areas: a rural woman has on average
1.6 children more than an urban woman.39
In 1995, the State
spend 1990 CFA/per capita on health.40 According to the
World Bank, the amounts destined to primary health care
went from 48.6% of the total spending on functioning and
equipment in the 81-82 period, to 61.8% in 89-90.41
Despite all this, health spending only represented 1.5%
of the GNP in 1960 and 2.3% of GDP in 1990.42
For ORANA, the
theoretical calorific needs are 2,400 calories and 70
grams of protein per person per day. In Senegal the
average food intake was 2,295 calories per day and 63
grams of protein from 1993-94.43 According to the UNDP,
the Senegalese calorie count is 2,265.
In terms of food
spending, the Bank has set the poverty line in Senegal at
3,324 CFA franks per inhabitant per month. The poor spend
2,247 CFA on their food needs per month.44
Some 21.8% of children
aged less than one year old, between 6 and 59 months, are
underweight45 and the tendency seems to be towards the
situation becoming worse. In the rural areas, twice as
many children suffer from low weight or retarded growth
compared with the urban areas. This percentage is
ratified by the Ministry of Planning which said 22% of
children suffer from chronic malnutrition. Serious
malnutrition affects nearly 9% of children between 0 and
5 years-old.46
Co-operation, aid
and debt
Debt in Senegal
represented more than 50% of the GDP in 1992, and the
servicing of the debt took 21.4% of exports. Following
the devaluation of the CFA in 1994, the size of the debt
in local currency increased dramatically, reaching more
than 76% of the GDP.
The devaluation,
considered a pre-condition imposed by the World Bank and
the International Monetary Fund in order to re-establish
relations with Senegal, made it possible to sit down to
negotiations with the creditors and tackle the
refinancing and cancelling of debts. These measures,
along with the development of payments for exports (in
CFA) made it possible for Senegal's debt servicing to
fall from 21.4% in 1992 to 15.7% in 1995.
- The reductions in
debt registered in 1994 were worth around 188.9
million CFA.47.
- Negotiations with
the Paris Club by the Ministry of Economy and
Finance achieved a reduction of 87 billion CFA on
the debts which expired between April 1995 and
August 1997, which corresponded partly to the
cancellation of debt and partly to a new
repayment schedule. This achievement, obtained
according to the Naples conditions and for the
duration of the programme, made it possible to
annul 67% of the expired debts and this saved
29.5 billion on the servicing of the debt which
expired in (see Lyons Agreements).
- On another front,
in 1995, Senegal signed agreements with creditors
in the Arab countries to set new repayment
schedules for an amount of 52.5 billion, with the
repercussion on the debt servicing for this year
being 15.3 billion.
Thanks to these
achievements, the amount of the payments for the State
budget only affected 21.7% of the public funds instead of
the 42% previously predicted. (See Table 1)
Has aid received been
orientated towards programmes or policies which take into
account the poorer and more vulnerable populations?
There are no recent
data on the use of public development aid according to
sector. But from another angle, given the small size of
the percentage of the budget which goes on public
spending, most of these investments must be funded by
foreign resources (74% in 1994).
| Table
1: Actual
servicing of the debt in 1995 (in millions CFA) |
| |
Capital
|
Interest
|
Total
|
| Multilateral |
24,817
|
21,214
|
46,031
|
| Bilateral |
16,830
|
12,397
|
29,227
|
| Corresp.
to OCDE |
7,836
|
9,872
|
17,708
|
It is difficult to
establish how much of this spending is aimed at the poor
and vulnerable categories as a matter of priority.
However, we know that
out of total public spending of 121.4 billion CFA in
1994, the social sector (quaternary) received some 48.8
billion, that is, 40%, In 1995, this percentage dropped
to 39%, which corresponded to an amount worth 69.9
billion. This tendency to fall seemed to continue in
1996, as the forecasts indicate social spending will be
91.4 billion out of a total of 237.2 billion, or 38%.
(See Table 2)
At present no
information is available on the implementation of the
20/20 agreement, neither from the level of the United
Nations system, nor the State of Senegal. However, the
government accepted the principle by which 20% of
spending and the 20% of aid received must be destined
towards human development priorities. A document entitled
«Strategies and elements of plans of action» should
begin to be applied.
The UNDP also supported
the option of the 20/20 proposal in its action for the
1998-2000 period. The institution also committed itself
to reminding the agencies of the United Nations and the
government of the commitments made in the Social
Development Summit.
In 1993, Senegal
received 644 million US dollars in public aid (322
billion CFA) which was equal to 11.0% of the GNP, which
is around US$ 62.8 per person.48 This amount per habitant
is one of the highest in the sub-region. According to the
Ministry of Economy, this amount should be 313.6 billion
CFA for 1996, of which 122.8 are donations and 190.8
loans.49 This reduction in the absolute value is due to
the fact the special programmes which accompanied the
devaluation of the CFA have come to an end.
France Japan and the
European Union were responsible for 95% of the donations
given in 1995 and a total of 122.8 billion CFA.
The Table 3 offers a
list of the seven most important agreements, which
exceeded 3 billion CFA.
|
Table 2 |
| Sub-sector |
Spending
|
Spending
|
Forecasts
|
| |
1994
|
1995
|
1996
|
| 11. Agriculture |
17,903
|
21,365
|
44,215
|
| 12. Livestock |
1,171
|
1,689
|
3,643
|
| 13. Water and Forestry |
6,527
|
5,736
|
7,986
|
| 14. Fishing |
99
|
1,187
|
2,243
|
| 15. Rur.&Agric. Water supplies |
8,561
|
15,756
|
11,462
|
| 18. Research |
4,237
|
3,858
|
4,044
|
| 19. Institutional support and technical
help |
6,673
|
7,266
|
7,415
|
| 21. Mines and geology |
820
|
966
|
854
|
| 22. Industry |
8,698
|
2,231
|
5,928
|
| 23. Crafts |
130
|
296
|
1,7
|
| 24. Energy |
2,965
|
15,677
|
11,499
|
| 28. Research |
779
|
2,765
|
2,922
|
| 29. Institutional support |
351
|
2,326
|
6,606
|
| 31. Trade |
--
|
--
|
--
|
| 32. Tourism |
20
|
555
|
530
|
| 33. Road transport |
6,188
|
17,798
|
22,153
|
| 34. Rail transport |
1,854
|
2,325
|
7,191
|
| 35. Sea transport |
872
|
1,756
|
1,29
|
| 36. Air transport |
935
|
820
|
323
|
| 37. Post services telecomm. information |
2,118
|
2,462
|
|
| 38. Research |
20
|
44
|
1,652
|
| 39. Institutional support |
1,71
|
1,395
|
2,104
|
| 41. Urban water supply and sanitation |
2,479
|
9,644
|
21,528
|
| 42. Culture youth and sport |
213
|
2,032
|
1,974
|
| 43. Urbanism and Habitat |
3,308
|
7,117
|
9,978
|
| 44. Health and nutrition |
8,821
|
12,301
|
11,142
|
| 45. Education and training |
11,381
|
9,649
|
19,978
|
| 46. Social Development |
2,133
|
4,414
|
3,103
|
| 47. Administrative teams |
4,177
|
5,89
|
6,848
|
| 48. Research |
94
|
768
|
354
|
| 49. Institutional support and technical
assistance |
16,184
|
18,139
|
16,539
|
| |
|
|
|
| Primary sector |
45,171
|
56,857
|
81,008
|
| Secondary sector |
13,743
|
24,261
|
29,509
|
| Tertiary sector |
13,717
|
27,155
|
35,243
|
| Quaternary sector |
48,79
|
69,954
|
91,444
|
| Total development projects |
121,421
|
178,227
|
237,204
|
|
Table 3 |
Investors
|
Objectives
|
Amounts (in
billions CFA)
|
| FRANCE
Min. Coop. |
Liquidation
of debts with Senegalese companies |
35,600
|
| E.U. |
Structural
adjustment support 95 |
12,870
|
| JAPAN |
AEP
of the 8 regions |
11,550
|
| JAPAN |
Construction
of classroom |
10,620
|
| JAPAN |
Water
supply support |
7,500
|
| FRANCE
CFD |
Structural
adjustment 2nd. stage |
7,000
|
| FRANCE
CFD |
Structural
adjustment 1st. stage |
5,000
|
| FRANCE
CFD |
River
Valley programme |
4,700
|
| E.U. |
STABEX
94 |
3,534
|
| E.U. |
Kermel
affair |
3,201
|
| JAPAN |
Food
production increase aid |
3,060
|
The total donations for
budget aid received by the State reached 84.1 billion in
1994 compared with 16.7 billion in 1993, and 20.5 billion
in 1992; this marked increase can once again be explained
by the support offered within the devaluation framework.
This effort should however continue, knowing that the
estimates for 1995 and 1996 indicate 112.9 and 118.2
billions respectively.
The latest figures of
1995 activity show however that the multilateral budged
aid was falling (85.5 billion); half of which
corresponded to the IMF (41 billion) within the
Reinforced Structural Adjustment Facility. The bilateral
budget support has meanwhile been 22.2 billion, that is,
fulfilling 77% of the forecast levels.
From a sectoral point
of view, the World Bank funded PASCO (the private sector
competivity programme) and PASA (the agricultural
structural adjustment programme); France and the IMF
funded the budget deficit and balance of payments
respectively; while Japan's budget aid is aimed mainly to
funding imports. The European Union (EU), lastly, funded
the Structural Adjustment Support Project, the
compensation agreed in the fishing agreements (15.8
billion ECU) and STABEX (6.9 billion CFA).
Analysis of the rate of
execution of the funding agreements show the IMF, France,
the United States and Japan are those who best fulfil the
agreements made. The other donors tend to be behind
schedule in paying up due to frequent problems in the
conditions set. The dominion of the foreign payments of
budget aid currently allow for the money to be delivered
15 days after the agreement is signed. (See Table 4)
Access to resources
and economic opportunities
With the increase of
unemployment in the eighties, the government had adopted
an employment encouragement policy. Various, mainly
institutional, measures were brought in to help the
government make decisions, but they were all insufficient
to generate the necessary number of jobs.
The strategy used by
the government on the employment front aimed to promote
labour intensive investment projects, the informal sector
and the PME/PMI. Two main objectives were aimed for:
adapting the work market to make it more flexible and
better qualified, and correcting certain negative effects
in favour of the groups affected.
In 1991, the percentage
of unemployment was 10.6%, with 8% amongst women and
11.5% amongst men.50 This especially affected young urban
men aged between 20 and 34, where it reached 40%.51 In
the rural environment, unemployment is lower. The problem
here is that the work is seasonal.
However, we can point
out that this percentage is certainly underestimated as
it does not take into account a number of situations
which increase the effective number of unemployed people:
like the fact for example that underemployment (above all
in the rural zones where this is very common) is seen as
the same as full time work: a person who only works one
month a year is considered economically active. In the
same way, the status of «housewife» is classed as an
activity, when in fact it often conceals female
unemployment.
|
Table 4: Budgetary aid
1995 (in cfa. F billions) |
| Source |
Prevision
|
Realization
|
Execution rate
|
| World
Bank |
38.0
|
29.6
|
78%
|
| IMF |
41.6
|
41.1
|
99%
|
| E.U. |
19.5
|
14.8
|
76%
|
| USA |
5.5
|
5.5
|
98%
|
| FRANCE |
13.0
|
13.0
|
100%
|
| JAPAN |
3.8
|
3.8
|
100%
|
| KUWAIT |
6.4
|
0
|
0%
|
| TOTAL |
127.8
|
107.7
|
84%
|
| From
multilateral |
99.1
|
85.5
|
86%
|
| From
bilateral |
28.7
|
22.2
|
77%
|
Underemployment is very
high in the rural areas due to the seasonal nature of the
work and the informal sector. Very often the status of
«trader» in the informal sector hides evident
underemployment. But, up until today, no survey has
evaluated this quantitatively.
According to the 1988
General Census of Population and Housing, Senegal has
2,231,085 active people distributed between 2,046,052
employed and 182,000 out of work or unemployed, that is,
a gross activity index of 32%. This figure is 45.9%
amongst men and 15% amongst women.52
The ESP, in January
1992, showed a gross activity index of 42% including:
- 55% of active
independents
- 8% of salaried
private sector workers (formal, informal, or home
workers)
- 2.8% of public
sector wage earners.53
A great disparity can
also be noted between Dakar and the other regions of the
nation: Dakar holds 74% of the workers in permanent
employment.54
Women are not favoured
in employment due, to a large extent, to their lack of
training. For example, only 15% of the 68,537 civil
servants are women. Similarly, only 4% of private sector
managers are women.55
The capacity for the
creation of jobs in the informal sector appears greater
than in the modern sector. The annual index of growth in
the informal sector was 4.3% between 1980 and 1991. Total
employment in this sector was estimated at 630,000 jobs
in 1991, of which 45% were in the region of Dakar.56 Some
18% of those active belonged to the informal sector in
1988 and 24.4% in 1991. Thus this sector has become
indispensable due to its contributions to the national
economy in terms of savings, investments, production, job
creation and income, satisfying the primary needs of the
population etc. It is the main provider of employment for
women.
The labour legislation
(laws relative to women's work) in the urban media mean
the State policy still does little to benefit women, even
though measures have been taken for them to be promoted
and to guarantee their rights.
Citizen
participation
Senegal is famous for
being one of the most democratic nations in Africa. There
is full freedom of association and expression. It has a
multiparty system with more than 15 parties. However, the
Socialist Party has been in power since independence and
dominates all the political institutions.
The elections have
progressively transformed into a predominant issue in the
political life of the country in the last ten years. The
political class generate contradictory public debates
through the press or meetings.
But the political
system and its institutions (parties, parliament) are
still far away from dealing with the concerns of the
population. The development of hundreds of independent
associations, especially in the rural areas, mainly
initiated by the people themselves on all levels, clearly
reflect the existing distance between the citizens and
the political rhetoric.
These associations try
to satisfy the needs of the population in areas where the
State is patently failing. The structural adjustment
which led to a rift between the State and the main
production sectors, and the weakening of its social role
gave rise to the development of the association movement.
There are such groups to deal with all the social causes:
the role of women, the status of children, religion,
defence of the environment, consumer interests, defence
of the rural population...
Municipal elections are
held every five years. In November 1996, local elections
were held after the «regionalisation» law was passed -
legislation agreed in the framework of the
decentralisation of the State. These elections allowed
for the renovation of the municipal and rural councils,
and the implementation of new regional councils. These
regional assemblies, arising from the 1996 reforms,
participate at a regional level in the economic and
social development of the nation.
Following several years
of structural adjustment, many people are asking if this
decentralisation is not derived from the quest for better
management of indigence and if, on another front, it does
not hand back the economic and political power the
political class had partially lost when the State was
obliged to reduce its commitments and rationalise the
administration of public funds.
The most important
question we are left asking is if a real democracy and an
effective participation in public affairs can exist in a
context of impoverishment with a high level of
illiteracy. For isn't this context more biased towards
the deviations of patronage and the emergence of
religious or regional stratification?
Plans for the
eradication of poverty
Senegal has prepared a
National Plan to fight poverty over a five year period
with investments of close to 3% of the GDP. But this plan
has not yet been approved.
The aims are:
- to increase and
diversify income and create jobs for the poor
populations in urban and rural environments;
- to improve access
to the basic services: population, health,
education, literacy, drinking water and
sanitation;
- to improve
security and increase social action to attenuate
the damaging effects of the policies and the
programmes which affect the vulnerable social
levels and those coming from exceptional
situations (conflicts, natural disasters);
- to reinforce the
capacities of the living conditions.
The long term objective
is to reduce poverty by half.
Notes:
1 Bajo la
responsabilidad de Taoufik Ben Abdallah.
2 World Bank, World development report 1996.
3 Department of Forecasts and Statistics: Research on
priorities, social dimensions of adjustment, Dakkar,
1993.
4 UNDP, World Human Development Report 1996, Economic,
Paris, 1996.
5 Department of Forecasts and Statistics: ESP, Dakkar,
1993.
6 Ministry of Economy and Finance, Planning Department:
Plan to Guide for Economic and Social Development,
1996-2001, (IX plan), Dakkar, August 1996.
7 Aboulaye SADIO: Child labour in Senegal: methodological
survey, Ministry of Economy and Finance, DPS, Dakkar,
July 1993.
8 Ministry of Economy and Finance, Dakkar, December 1996.
9 ESP, op cit, 1993.
10 Boubacar SONKO: Overall analysis of strategies,
policies and programmes on employment, BIT, April 1996.
11 UNDP, op cit.
12 Ministry of Economy and Finance, Dakkar, December
1996.
13 UNDP, op cit.
14 Ministry of Economy and Finances, Dakkar, December
1996.
5 ESP, op cit, 1993.
16 Ministry of Economy and Finance, Planning Department:
Plan to Guide Economic and Social Development, 1996-2001,
(IX plan), Dakkar, August 1996.
17 ESP, op cit, 1993.
18 Ministry of Finance, Department of Debt and
Investments: The development of investments from 1994 to
1997.
19 World Bank, World development report 1996.
20 Ministry of Economy and Finance, Planning Department:
Plan to Guide Economic and Social Development, 1996-2001,
(IX plan), Dakkar, August 1996.
21 EDS II, Demographic and Health Survey (II), 1992.
22 World Bank, Human Development Report, 1995.
23 Ministry of Economy and Finance, Planning Department:
Plan to Guide Economic and Social Development, 1996-2001,
(IX plan), Dakkar, August 1996.
24 EDS II, Demographic and Health Survey (II), 1992.
25 UNICEF, State of the Worlds Children Report, 1993.
26 IPEC, ILO and UNICEF: The work of children in Senegal,
Dakkar, 1996.
27 Ministry of Economy and Finance, Planning Department:
Plan to Guide Economic and Social Development, 1996-2001,
(IX plan), Dakkar, August 1996.
28 Ministry of Economy and Finances, Dakkar, December
1996.
29 Ministry of Economy and Finances, Dakkar, December
1996.
30 UNDP, op cit.
31 UNDP, op cit. and Ministry of Economy and Finance,
Planning Department: Plan to Guide Economic and Social
Development, 1996-2001, (IX plan), Dakkar, August 1996.
32 Ministry of Economy and Finances, Dakkar, December
1996.
33 EDS II, Demographic and Health Survey (II), 1992.
34 World Bank, Senegal, evaluation of living conditions,
April 1994.
35 UNDP, op cit.
36 ESP, op cit.
37 Ministry of Economy and Finance, Planning Department:
Plan to Guide Economic and Social Development, 1996-2001,
(IX plan), Dakkar, August 1996.
38 World Bank, Senegal, evaluation of living conditions,
April 1994.
39 Ministry of Economy and Finances, Dakkar, December
1996.
40 Ministry of Economy and Finances, Dakkar, December
1996.
41 World Bank, Senegal, evaluation of living conditions,
April 1994.
42 UNDP, op cit.
43 Cellule Agro-Sylvo-Pastorale (CASPAR).
44 ESP, op cit, 1993.
45 DPS II, Dakar, 1992.
46 Ministry of Economy and Finance, Planning Department:
Plan to Guide Economic and Social Development, 1996-2001,
(IX plan), Dakkar, August 1996.
47 Source: Ministry of Economy and Finance.
48 UNDP Human Development Report, 1996.
49 Source: Ministry of Economy and Finance, Senegal,
1996.
50 Ministry of Economy and Finances, Dakkar, December
1996.
51 Department of Forecasts and Statistics; ESP, Dakkar,
1993.
52 Boubacar SONKO: Overall analysis of strategies,
policies and programmes on employment, BIT, April 1996.
53 ESP, op cit, 1993.
54 Boubacar SONKO: Overall analysis of strategies,
policies and programmes on employment, BIT, April 1996.
55 Ministry of Economy and Finance, Planning Department:
Plan to Guide Economic and Social Development, 1996-2001,
(IX plan), Dakkar, August 1996.
56 Ministry of Economy and Finance, Planning Department:
Plan to Guide Economic and Social Development, 1996-2001,
(IX plan), Dakkar, August 1996.
|
