|
|
|
|
| | ESPAÑOL | Commitments | Annual Report | News | About | Feedback |
 |
 |
 |
|||||||
| |
|
|
|
|
|
|
|
|
|
|
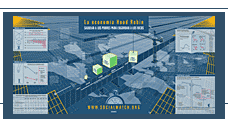
NOTES TO THE GRAPHS The main graph on net transfer of financial resources, and the table in the lower left corner are based on the data included by the UN secretary-general in his report on "International financial system and development", UN General Assembly document A/57/151. 2 July 2002. Figures on Official Development Assistance (ODA) are based on data provided by the Development Assistance Committee of the Organisation for Economic Co-operation and Development (OECD). Eurodad (www.eurodad.org) is the source of the data linking debt and HIV/AIDS. Figures on trade and commodity prices are based on data from UNCTAD (www.unctad.org) and Third World Network (www.twnside.org.sg). The graph on the cost of capital mobility for the poor is based on data published by Oxfam America in its report "Global Finance Hurts the Poor. Analysis of the impact of North-South private capital flows on growth, inequality and poverty. An Oxfam America Report", May 2002. All figures are in 1995 dollars. The capital inflow-induced growth is estimated by the World Bank. The part of this income that benefited the poorest 20% is based on the poorest 20% of the population receiving between 3% and 10% of total income in most developing countries. The part of the transfers paid by the poor was estimated on the assumptions that (i) the whole fiscal cost is eventually paid for by extra taxes without reducing spending; (ii) the ratio of consumption taxes in total government revenues remains unchanged; (iii) consumption inequality remains unchanged; and (iv) the poorest 20% of the population only pays taxes on consumption, in the same proportion as the rich. This is a conservative estimate as tax and spending systems in developing countries are often regressive. Global income inequality was estimated by UNDP's "Human Development Report 1999". Boxes on the burden of debt repayment are based on data from the World Bank's, "Global Development Finance 2001", the Jubilee 2000 report "Unfinished Business" and the IMF website (www.imf.org). |